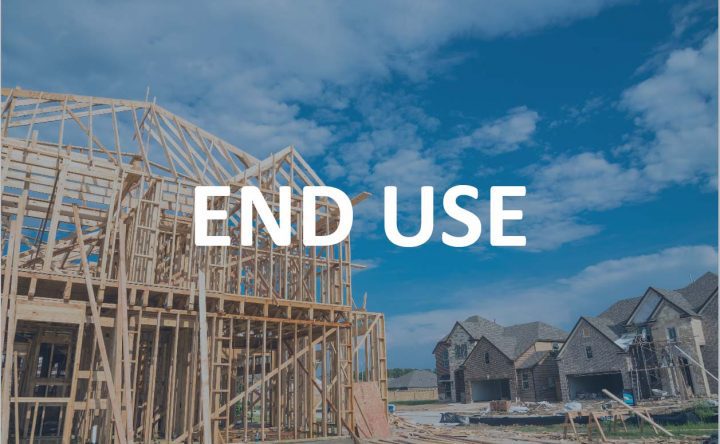
According to the S&P CoreLogic Case-Shiller U.S. National Home Price NSA Index, which covers all nine U.S. Census divisions, home prices experienced a 14.6% annual gain in April 2021, up from 13.3% in March. The 10-City Composite annual increase came in at 14.4%, up from 12.9% in the previous month.
News in end use
Federal Housing Finance Agency Reports U.S. Home Prices Increase 1.8% Month-Over-Month and 15.7% Year-Over-Year in April 2021
According to the Federal Housing Finance Agency (FHFA) House Price Index (HPI®) U.S. house prices increased 15.7% from April 2020 to April 2021. FHFA’s seasonally adjusted monthly index for April 2021, was up 1.8% from March 2021 upwardly revised 1.6% increase.
Shares of Mortgages in Forbearance Decline for 17th Week in a Row in Week Ending June 20th, 2021
The latest Mortgage Banker Association’s (MBA) Forbearance and Call Survey reports that the total number of loans now in forbearance decreased by 2 basis points from 3.93% of servicers’ portfolio volume in the prior week to 3.91% as of June 20, 2021.
Real GDP at State-Level for Q1 2021
According to the latest U.S. Bureau of Economic Analysis (BEA), with further evaluation provide by National Association of Home Builders (NAHB), real gross domestic product (GDP) when compared to Q4 of 2020, advanced in all 50 states and the District of Columbia in Q1 2021.
Housing Market Continues to Cool as Mortgage Rates Move Higher
Redfin is reporting that the Redfin Homebuyer Demand Index (HDI) has fallen below 2020 levels for the first time this year, down -1% year-over-year in the week ending June 20th, 2021.
Home Builders Cut Construction Time by 10-days in 2020
According to the U.S. Census Bureau’s 2020 Survey of Construction (SOC), with analysis provided by the National Association of Home Builders (NAHB), the average completion time of a single-family house was around 7.8 months, which typically includes a little over a month from authorization to start and
another 6.8 months to finish the construction. It took approximately 10 days less in 2020 when compared to 2019, pausing the upward trend started in 2014.
Personal Income and Disposable Income Decline While Personal Consumption Expenditures Rise in May
The U.S. Bureau of Economic Analysis (BEA) reported on Friday (6-25-21) that according to their estimates, Personal Income decreased -$414.3 billion or -2.0% in May 2021. Disposable personal income (DPI) decreased -$436.3 billion or -2.3% and personal consumption expenditures (PCE) increased $2.9 billion, or less than 0.1%.
Index of Consumer Sentiment up 3.1% Month-Over-Month in June and 9.5% Year-Over-Year
The University of Michigan today (6-25-21) released its “Final” Index of Consumer Sentiment (ICS) for June. Month-over-month the ICS rose 3.1% from 82.9 in May to 85.5 in June. When compared to June 2020, the ICS increased 9.5% or 78.1 to 85.5.
Real GDP for Q1 2021 Reported at 6.4% in “Third” Estimate
The Bureau of Economic Analysis (BEA) released today (6-24-21) its “third” estimate of real gross domestic product (GDP) for Q1 if 2020, reporting it was at an annual rate of 6.4%. This is the same level as in the previously reported “advance” and “second” estimates.
State-Level Analysis of Construction Employment for May 2021
A deeper look into the Bureau of Labor Statistics (BLS) nationwide total of nonfarm payroll employment for May, with analysis provided by the National Association of Home Builders (NAHB), reveals that nonfarm payroll employment increased in 33 states and the District of Columbia in May, when compared to April, while 16 states lost jobs.


