
Separating Particleboard And TFL
FEA has revised historical particleboard trade volumes for the US and Canada to separate value-added product, primarily thermally fused laminate (TFL), from raw particleboard totals. Until now, we have presented both raw and value-added product as particleboard trade volumes in our historical data and forecasts. Separating the two will improve our analysis of the particleboard market and allow us to examine the TFL market on its own.
We will present these revised numbers beginning with our January 2019 monthly and Q1 2019 quarterly forecasts.
Trade
Isolating the raw particleboard volumes allows for a direct comparison to the shipment numbers reported by the Composite Panel Association. Those volumes are of raw particleboard prior to value-added manufacturing. Most of the surface-covered volume is TFL. A portion is described as covered with plastic or other materials. We focus here on the revised raw particleboard and TFL trade numbers. Note that we have added a few codes not previously included.
Fortunately, we have consistent numbers for US raw particleboard and TFL imports from Canada and from offshore. For some trade flows, however, the data is spotty. There are no reported US TFL exports to Canada after 2006. For Canada in general, we cannot separate raw from value-added particleboard shipments. As we do for other panel products, we use reported US import and export numbers for all the US/Canadian trade. Without more specific information, we assume the Canadian offshore trade is all raw particleboard.
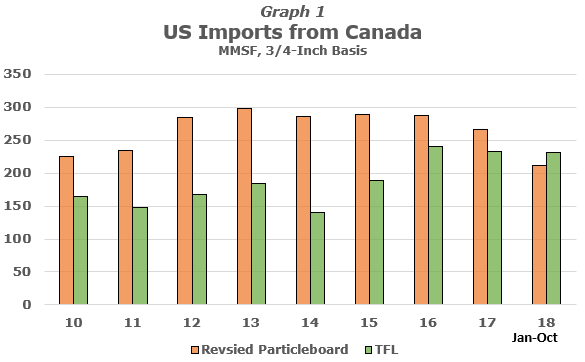
Graph 1 shows the revised US particleboard and TFL imports from Canada. For all of 2017, US raw particleboard imports from Canada were 266 MMSF; US TFL imports from Canada were 233 MMSF. Our old total for 2017 was 499 MMSF. Data for 2018 through October show a 9% year-over-year drop in US raw particleboard imports from Canada (211 MMSF) and a 15% increase in TFL volumes (232 MMSF).
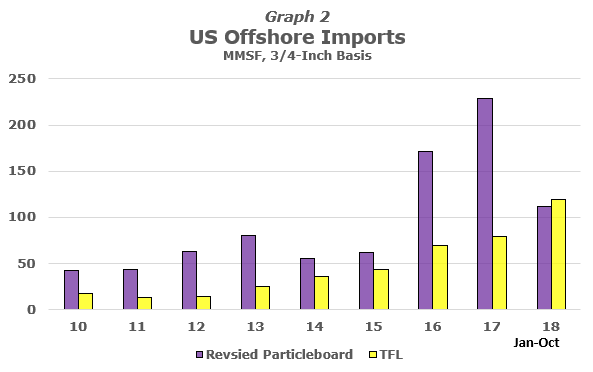
Graph 2 shows the revised US imports from offshore. Note the sharp run-up in offshore volumes in 2017. At the time, we discussed this growth in our publications, and these numbers indicate the growth was of raw panels, and not TFL.
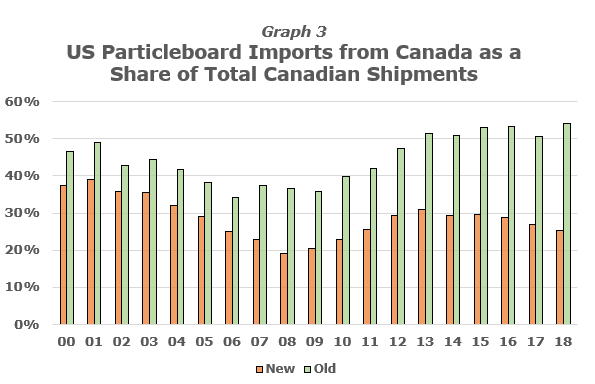
With raw particleboard trade isolated, one can look at trade volumes as a share of shipments. Graph 3 shows the share of Canadian domestic shipments that are sent to the US. Revised US imports from Canada represent 25-30% of Canadian shipments. Previously, with TFL included, that share was over 50%. That larger, “old” volume is still making its way to the US in the form of both raw board and TFL.
Demand
We have not removed any volume moving between the US and Canada that was reported using our old methodology. Rather, we have reclassified it. The US TFL and other surfaced-covered imports from Canada that were previously counted as part of US domestic particleboard consumption are now counted as domestic Canadian consumption. In this case, the “consumption” is raw particleboard processed into TFL, which is then shipped to the US.
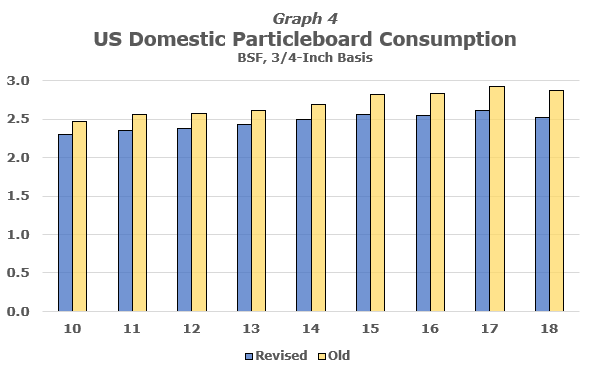
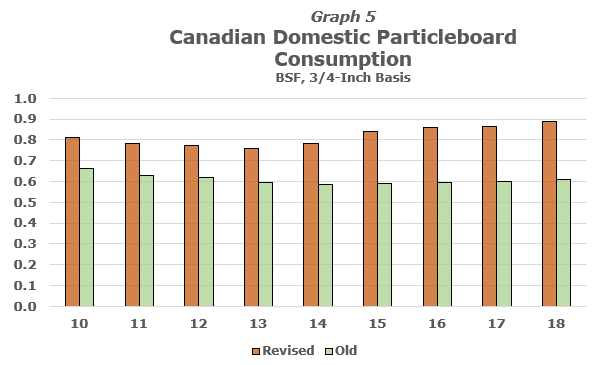
The adjusted US/Canada trade flows require revisions to usage rates to balance supply and demand. Our estimate of US domestic particleboard consumption for 2018 is 12% below our previous estimate (Graph 4). Canada domestic consumption is 45% higher than before (Graph 5).
The only volumes now excluded from our assessment of the North American particleboard market are those of offshore US trade of value-added product. Because those volumes are small, removing them shrinks estimated total market size only slightly. Revised North American particleboard supply (domestic shipments plus imports) is 2% lower in 2016-18 than previously measured.
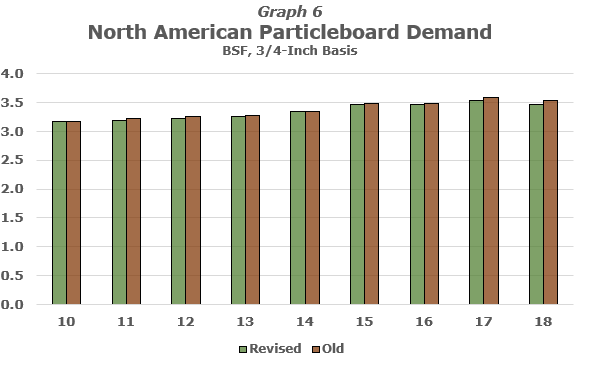
As a result, despite the changes to country-level consumption, revised North American particleboard domestic consumption is 1.5-2% lower over the past few years than our old estimates. For 2018, we now estimate North American domestic consumption of 3.41 BSF, compared with 3.48 BSF previously. Total North American particleboard demand (domestic consumption plus offshore exports) for 2018 is now estimated at 3.46 BSF, compared with 3.54 BSF previously (Graph 6). Our overall assessment and outlook for the North American particleboard market is unchanged.
Demand/Capacity Ratio
Our primary measure of market tightness, the demand/capacity (D/C) ratio, uses demand on mills (total demand minus imports) as the numerator.
Theoretically, we should have been able to remove the trade volumes from demand estimates on a one-for-one basis, and the demand-on-mills concept would be the same. In practice, the fact that the change in imports isn’t uniform over time means the demand on mills and resulting D/C ratio forecast will be different. Also, we took the opportunity to adjust the relative volumes for each end-use market. Nevertheless, the revised D/C ratios are very close to our previous estimates, with 2018 at 70%.
We are continuing to gather more information on the breakout of raw versus value-added products and may make some adjustments to these figures in future forecasts. We believe additional changes will be minor.
We will track reported particleboard and TFL trade volumes, and will include reported US TFL imports in the downstream import dashboard FEA has put together. If you would like a sample copy of that report, please contact us.
FEA compiles the Wood Markets News from various 3rd party sources to provide readers with the latest news impacting forest product markets. Opinions or views expressed in these articles do not necessarily represent those of FEA.