
- How do I log in?
- Click on the LOG IN button in the upper right-hand corner.
- Enter your email address and password.
- Click LOG IN.
- How do I reset my password?
- If you are already logged in, go to PROFILE.
- Enter a new password.
- Confirm the new password.
- Click CHANGE PASSWORD.
- If you are not logged in, go to the LOG IN screen and click LOST YOUR PASSWORD?
- Enter your email address.
- Click RESET PASSWORD.
- Once you receive the reset password email, click the Reset your password button. This email will come from info@getfea.com.
- Enter a new password.
- Confirm the new password.
- Click CHANGE PASSWORD.
- If you are already logged in, go to PROFILE.
- Where can I find the latest documents for a publication?
Once logged in, select PUBLICATIONS from the top menu. Then click on the name of the publication you are looking for. On the publication description page click on the GET THE LATEST … button. On the publication page you will find a brief executive summary of the report and, below that, any documents associated with that publication.
- Where can I find the latest FEA Spotlights?
Once logged in, select SPOTLIGHTS and then on the name of the spotlight you are looking for.
- Where can I find the latest Analytical Tables?
If applicable, Analytical Tables can be found as part of the publication documents. See Where can I find the latest documents for a publication?
- Where can I search for series?
The Data Center is the best place to search for and download series from across FEA’s suite of publications. To access this, log in, select DATA from the top menu; then select DATA CENTER.
- I can’t see the information in my browser!
Are you using Internet Explorer? Our website is not fully compatible with Internet Explorer. Our website is designed to give you all the features and functionality that are available on the latest browsers. We cannot make our website backwards compatible with it and retain the functionality you expect from a modern delivery system.Our website is compatible with the latest versions of all modern browsers. If you are having trouble seeing the information, please upgrade to the latest version of your browser.
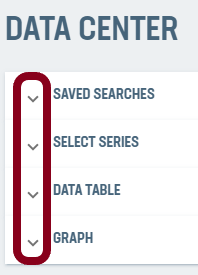
- How is the Data Center organized?
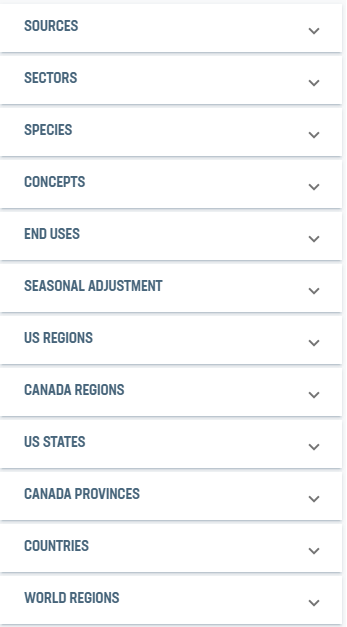
There are four accordion-style tiles within FEA’s Data Center. Each one can be expanded or contracted as you see fit by click on the carrot symbol to the left of each tile.

- SAVED SEARCHES: This is where you will find any previously saved searches. This area also where you will manage what is or is not displayed on your Dashboard.
- SELECT SERIES: Here you can filter the series list to find exactly what you are looking for. This section is where you add series to the DATA TABLE and GRAPH sections.
- DATA TABLE: The heart of the Data Center, this is where you can view the data. Additionally, this section allows you to convert to a different display frequency, select your preferred unit of measure and currency and change the dates displayed. Note: not all series can be converted. See “What series cannot be converted?”
- GRAPH: This section contains a graph of all series found in the DATA TABLE and graph options such as, Title, Axis Labels, Chart Type, Y-Axis options, and Stacking options.
- How can I find data in the Data Center?
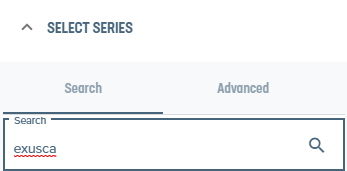
- Filter by series name
- If you know the FEA series name, this will be the quickest route to the series you are looking for. Simply type all or part of the series name into the Search box and hit
Enter.
- If you know the FEA series name, this will be the quickest route to the series you are looking for. Simply type all or part of the series name into the Search box and hit
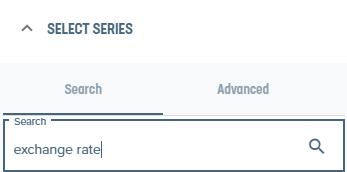
- Filter by description
- If you would prefer a keyword search, use the Search box and hit
Enterto find what you are looking for.
- If you would prefer a keyword search, use the Search box and hit
- Filter by categories
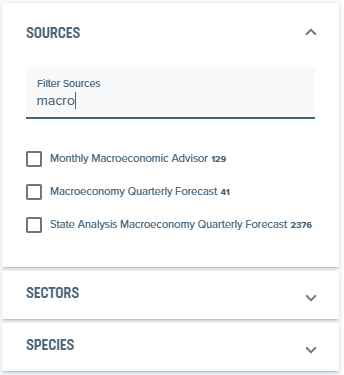
- Below the Search box are a series of categories which allow you to filter a number of different ways. Simply expand a category and select the information you are interested in.
- To search within the categories, start typing within the Filter Source box for that category.
- Below the Search box are a series of categories which allow you to filter a number of different ways. Simply expand a category and select the information you are interested in.
- Clear Filters
- To clear any filters you may have, either click on CLEAR ALL or click on the X next to any existing filters that you no longer care to use.
- To clear any filters you may have, either click on CLEAR ALL or click on the X next to any existing filters that you no longer care to use.
- Filter by series name
- How can I manage my search?
- To save a search, in the SAVED SEARCHES tile, enter a name into the Name search box and click SAVE.
- You can load Saved Searches by clicking on their name.
- If you modify your search, click on the update button.
- To delete a Saved Search, click on the delete button.
- How can I download the data?
Click on the DOWNLOAD TABLE AS EXCEL FILE button found below the table in the DATA TABLE tile.
- How do I download the graph?
- Click on the button in the upper right-hand corner of the graph.
- Select the file type you prefer (PNG, JPEG, PDF or SVG)
- Click on the
- What series cannot be converted (i.e. different frequency, unit of measure, currency, etc.)?
- Frequency: Only series that have a default frequency of weekly can be displayed weekly.
- Currency: Only nominal currencies can be converted.

 button.
 button.
 button in the upper right-hand corner of the graph.
- How do I add a table or graph to my dashboard?
From the Data Center’s SAVED SEARCHES section, click on either the Add table to dashboard or Add graph to dashboard button.
- How do I add a table or graph to my dashboard?
There are two ways this can be done:
- From the Data Center’s SAVED SEARCHES section, click on the Remove from dashboard button.
- From MY DASHBOARD, click on the options button and select REMOVE FROM DASHBOARD.
- From the Data Center’s SAVED SEARCHES section, click on the Remove from dashboard
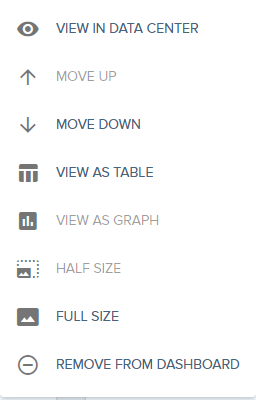
- What options are available in My Dashboard?
- VIEW IN DATA CENTER: Takes you to the Data Center where you can modify the search. Note: If you save your search modifications without saving as a new search will show up in the dashboard.
- MOVE UP: Allows you to move the tile in question “up” one position in the order.
- MOVE DOWN: Allows you to move the tile in question “down” one position in the order.
- VIEW AS TABLE: If the current display is a graph, this will allow you to switch it to a table.
- VIEW AS GRAPH: If the current display is a table, this will allow you to switch it to a graph.
- HALF SIZE: Allows the resizing of the tile to the narrower sized tile.
- FULL SIZE: Allows the resizing of the tile to the wider sized tile.
- REMOVE FROM DASHBOARD: Removes the tile from the dashboard. Note: this does not delete the saved search from the Data Center. Should you wish to add the search back to the dashboard, see the “How can I manage my search?” section.
 or Add graph to dashboard
  button.
 button.